Program Overview
Ask people what comes to mind when they think of Excel, and odds are they’ll say “spreadsheets”. The truth is Excel is an incredibly powerful and dynamic data visualization platform for those willing to think beyond rows, columns, and primitive pie charts — and we are here to prove it.
This program gives you a deep, 100% comprehensive understanding of Excel’s latest data visualization tools and techniques. We will show you when, why, and how to use each Excel chart type, introduce key data visualization best practices, and guide you through interactive, hands-on demos and Excel exercises every step of the way.
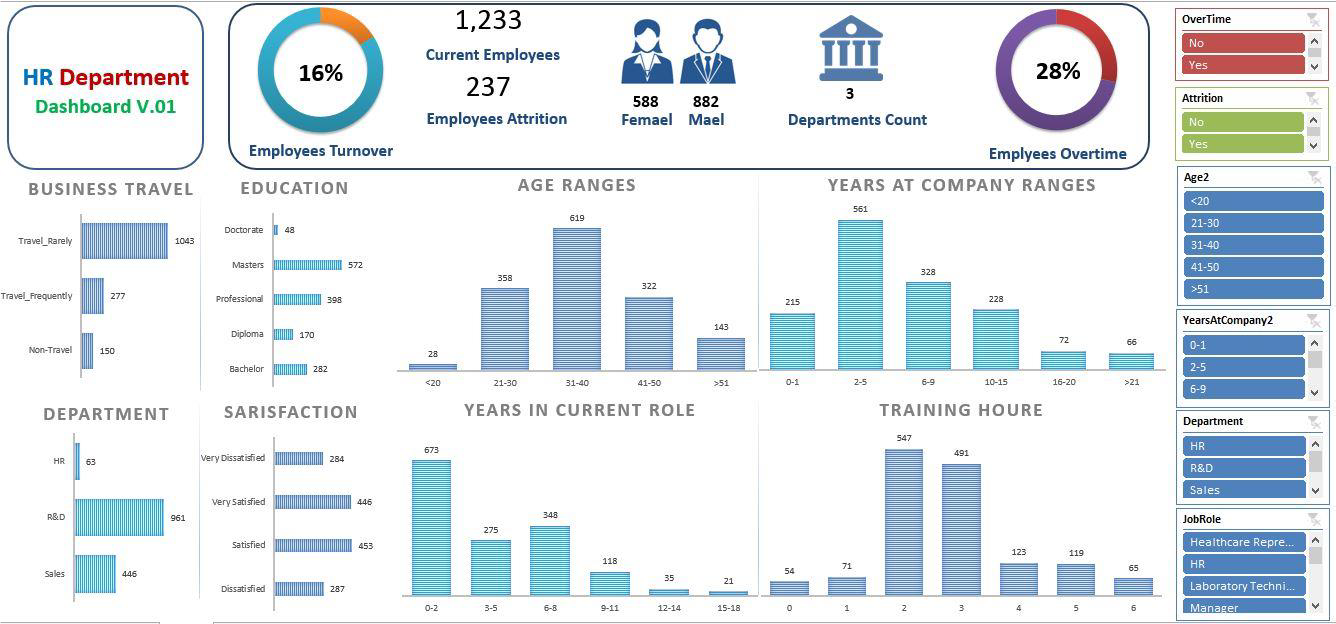
In this program you will know how to create amazing interactive Excel dashboards, like the ones below that update with the click of the Refresh button, or with a simple copy and paste of your new data into your spreadsheet. You will wow your boss and take your career to the next level.
We will be using Excel as a business intelligence tool. An Excel Dashboard provides insight, analysis, and alerts. They are fully interactive and dynamic and can help with project management, sales, HR, customer service, logistics, procurement, supply chain, warehouse, financial forecasting and much more.
Program Content
- Data Visualization meaning and concepts.
- Understand WHEN, WHY, and HOW to use 20+ chart types in Excel 2016+.
- Using Colors and Color Schemes.
- Create Pivot Table.
- Using Slicer in Excel.
- Learn how to use Power Query.
- Learn how to use Power Pivot.
- Build Excel HR dashboard designed to take your data visualization skills to the next level.
- Usually fits on one page.
- Displays key trends, comparisons, and data graphically or in small tables
- Employs best practices that enable the report to be updated quickly and easily (often at the click of just one button)
Prerequisite
- Microsoft Excel, ideally 2016+ or Office 365 for PC (some charts are not available in other versions of Excel).
- All attendees familiar with excel.
Program Benefits
Upon completion of this course, participants will be able to:
- Already prepare reports of any kind that require updating with new data on a regular basis (weekly, monthly….) and or,
- Want to learn how to build interactive dashboard reports and or,
- Work with charts and or,
- Work with large volumes of data and or.
- Often do not know the best chart to use to display your data.
Who Should Attend
HR Professionals
Course Duration
6 days – 3 Hours/day
Registration Deadline
Three days before the course date.
Registration and Payment
- Open www.thetraining-hub.com/ Training Facilities/Course Registration and fill your registration form.
- Course fees include material, lunch, 2 coffee breaks and certificate.
- Payment by cheque in The Training HUB’s name, cash to our address or by bank transfer.
- Your registration is confirmed only after course payment
- Payment is non-refundable; however, participant can be substituted or can attend next confirmed round of the same course or another course.
For More Information
Phone: 02 22907369 / 22909369
Mobile: 01280720167- 01280653407
Email: info@thetraining-hub.com